It’s time to learn a few new tricks with vector graphics using simple shapes, patterns and gradients. With the popularity of the first charts and graphs set, there were a few OpenGraphicDesign.com fans asking for a tutorial. Instead of providing a long and extended tutorial I decided to give you a vector file with each step already created for you. This way to can inspect and dissect each graphic and see how the final vector drawing was created. Now you too can create colorful chart graphics.

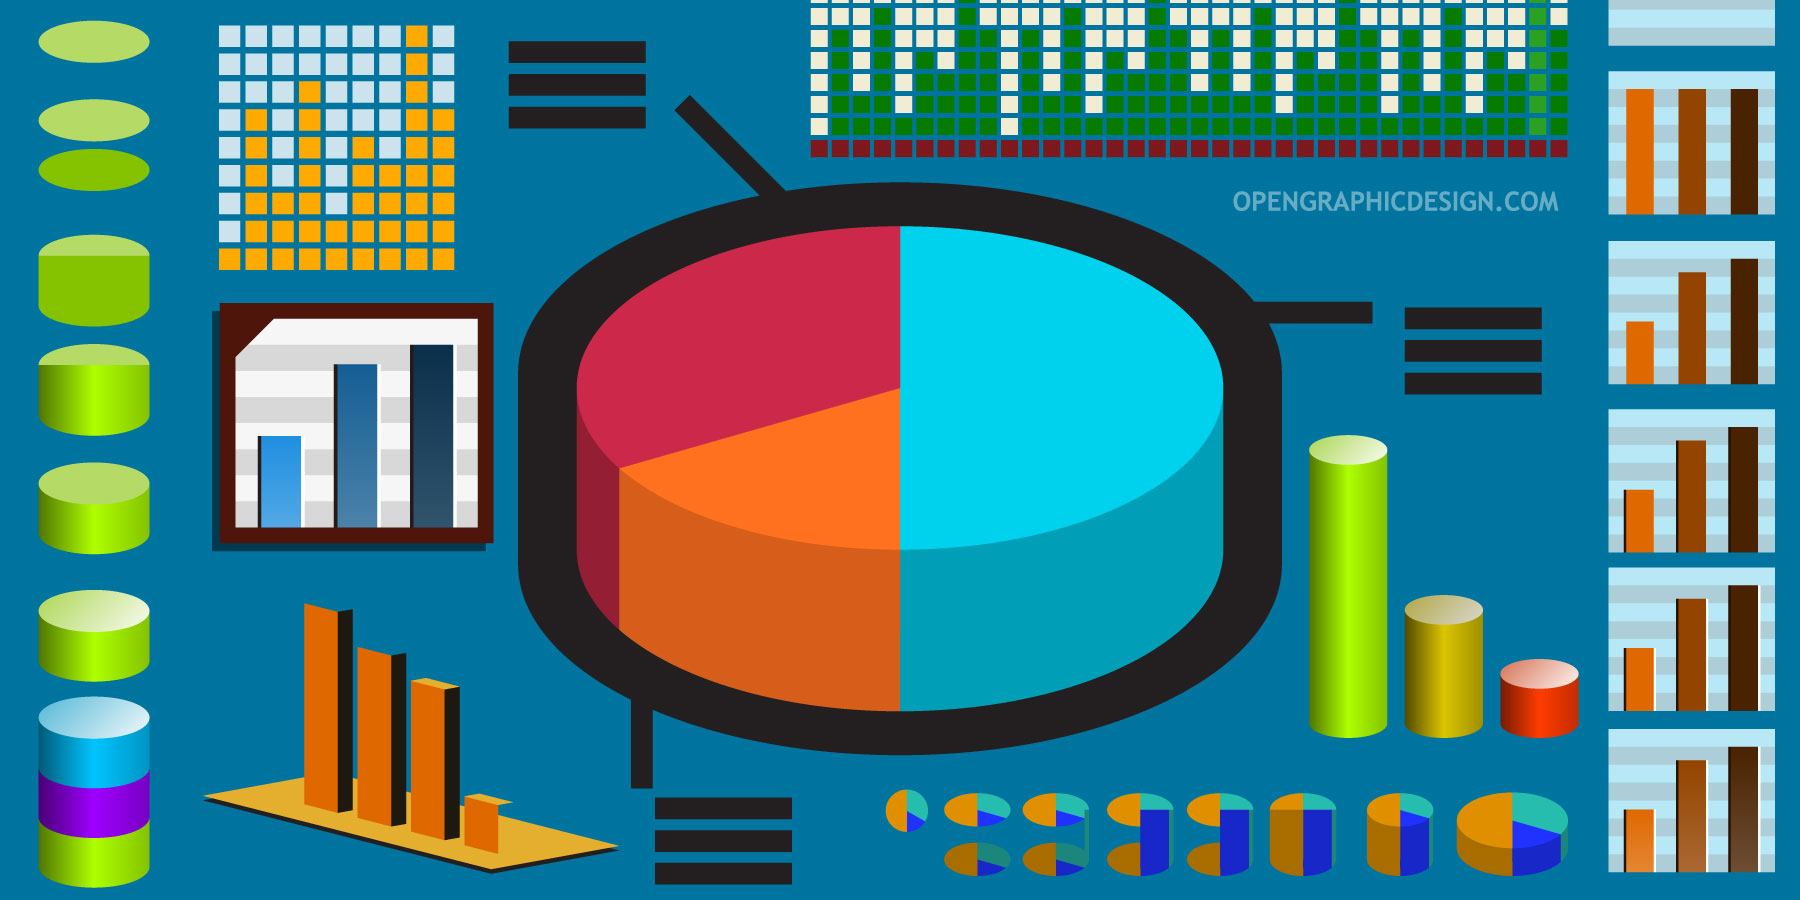
This vector set contains different variations of graphs and charts, from bar graphs to data charts. Of course these graphics are not plotted to any data, but instead they are simple representations to use as visual indicators. The key to creating nice vector graphs and charts is to add little details to the final element, such as shadows, rounded corners, gradients and color variations.
The vector file provided includes pie charts, line graphs, data plots, bar graphs and 3-dimentional graphs. These were all created using the most basic tools in Adobe Illustrator. Many of these graphics can be created much easier to create now with the use of the 3D tool, but for this simple how-to I decided to build the 3d elements from scratch.
Pie charts, data graphs and stackable graphs can be used in a variety of applications. Anytime you need to quickly represent data, a colorful graph can be useful to guide users. Use these type of graphics in:
- Icons for analytics page
- Icons for data grid
- Represent growth or increase on your website or printed material
- Show traffic or data patterns with vector graphics
- Use pie charts for fun facts
- Display current trends in revenue or traffic, or seasonal patterns
Download this set and try to recreate every graphic. There are a total of 5 different types of graphs on this set, but there are infinite variations that can be achieved with a little creativity. Remember to add some final touches to the drawing to make the graphics stand out. Use bright colors and subtle drop shadows, light gradients and complementary colors.
- Download Charts and Graphs – How To
- Illustrator vector file with graphics (.ai)
- EPS vector file (.eps)
- Scalable Vector Graphic (SVG vector)
- Thumbnail preview (.jpg)
If you like these pie charts and bar graphs, also check out:
Charts and Graphs in Vector Format
Simple Design Elements – how-to


I followed a link to download graphics and saw that your site is nice actually
very nice design