It is often very useful to show graphs and charts in order to give a visual representation of data. Graphs can be extremely useful for providing a quick glimpse into patterns, trends and future outcomes. Information can be easier analyzed when data is plotted into charts, such as pie graphs or bar charts. The purpose for this set is to provide ideas on how data can be represented as often times we don’t have enough numbers or data for creating graphs, but would like to show clients a sample of possible future outcomes.

This set of charts and graphs is purely for representation, as there are no exact numbers or real data that is being displayed. While real line graphs can be created using excel spreadsheets, sometimes we just need a quick chart to use as clip art.
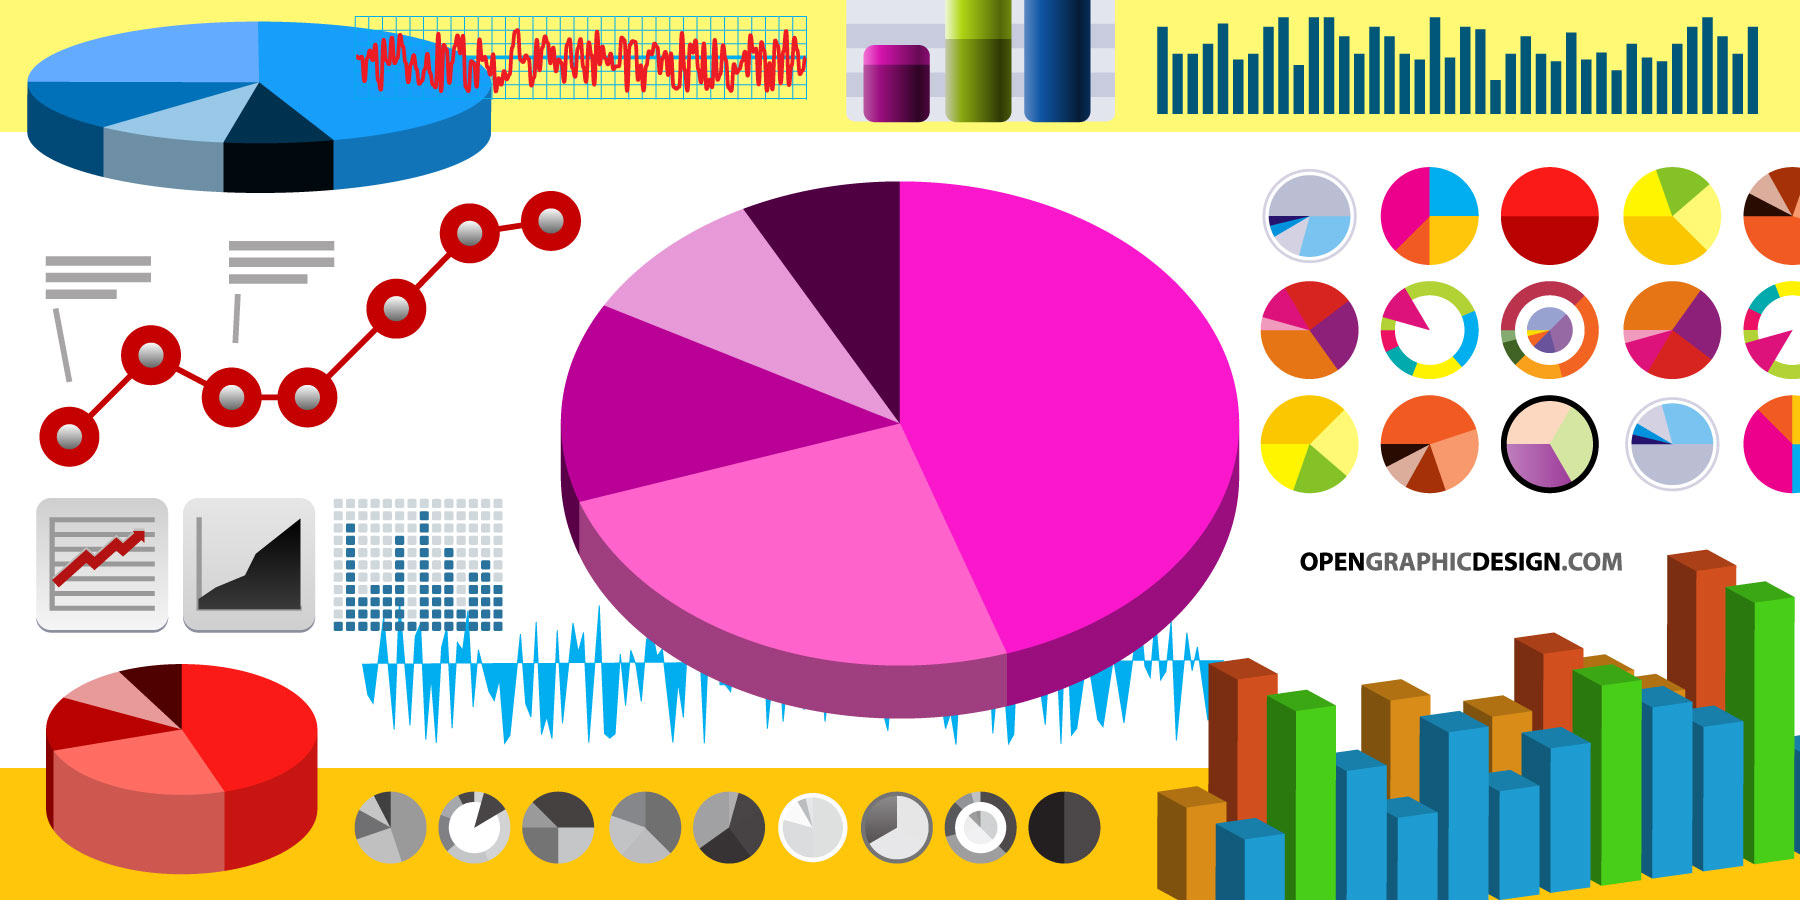
This set contains various colorful charts in vector format. Some samples include pie graphs, bar graphs, circle graphs, line charts, and other statistical graphs. If you’re collecting visitor information on your website, you have probably seen various analytic graphs used. The vector graphics in this set can be used to represent:
- financial figures
- traffic uptrends
- stock charts
- calorie charts
- conversion charts
- business growth
- data reports
- investment numbers
- and calculations.
With various options in charting numbers, you can easily plan and create your own 3d vector graphs. Download this set and create your own set of vector diagrams.
- Download Free Charts and Graphs
- Illustrator vector file with all templates (.ai)
- Vector EPS (.eps)
- Scalable Vector Graphic (SVG vector)
- Thumbnail preview (.jpg)
If you like this set and want to learn how these graphics were made, see our tutorial: Charts and Graphs in vector – How To


Guys I’m working on a magazine and its not really fun cause i need vectors on Bar charts and dont know how to get going with it.
Can someone please help…
why i cannot downlaod them?? :( only the principle image !!
thank you so much for the share.. i was searching the net for these, and it’s rly hard to come by…
thanks for sharing! :)
thanks so much!!!
thanks,, very nice :)
thanks so much!!!
I love you for this. Thanks a million :)